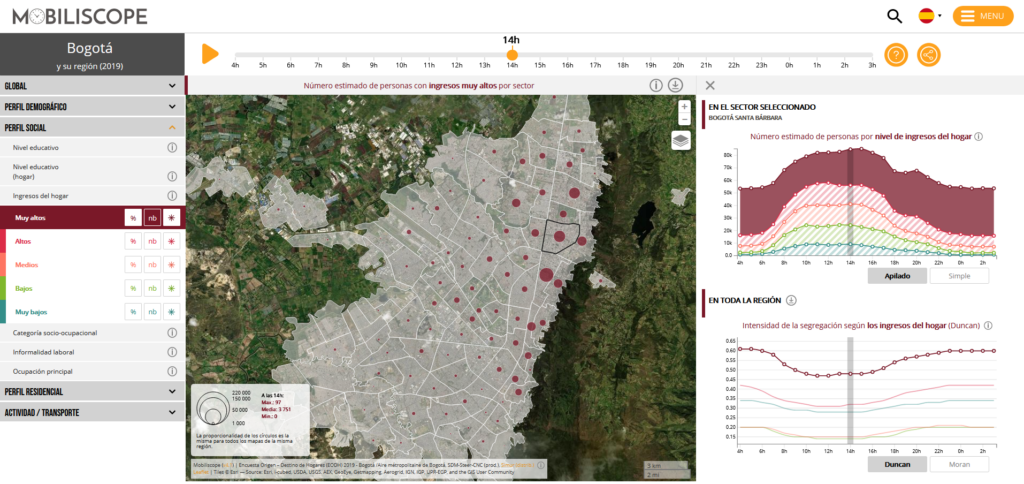
Mobiliscope (mobiliscope.cnrs.fr) is an open online geographic visualization tool that can be used to explore the daily rhythms and population’s social mix within city regions. Who regularly goes to what urban neighborhood or district? What transportation modes do they use to get there? Which areas are particularly attractive? How wide and intense is spatial segregation between rich and poor? Mobiliscope’s answers to these and many other questions vary by time of day.
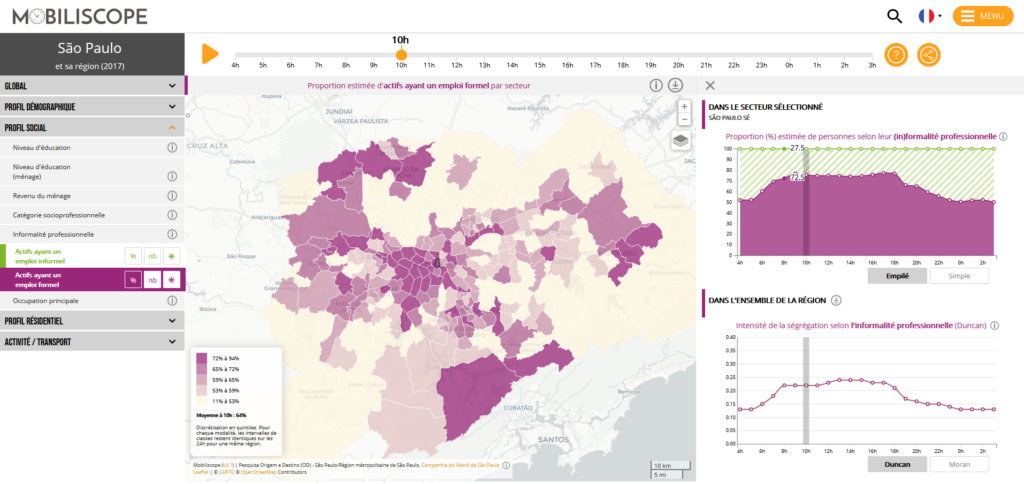
Designed and developed at laboratory Géographie-cités, this tool has been extended in partnership with French Institute for Demographic Studies (Ined) to three major Latin American cities (Bogotá in Columbia, Santiago in Chile and São Paulo in Brazil) in addition to the 49 French and 6 Canadian city regions already accessible. There are also new indicators, such as household composition, now available for all cities, and informal employment, available for Bogotá and São Paolo.
The geographical extension of Mobiliscope demonstrates that the methodology is not specific to a given country but may be replicated and used in a great number of cities from different regions across the world using local survey data. The daily rhythms of a rising number of cities in different countries may now be studied comparatively, an approach further facilitated by the three-language interface—French, English, and Spanish—and the fact that all Mobiliscope data and procedures are available in open access.
Read the press release (in French, English and Spanish)